For this project, we were asked to use Gait Analysis to take a deeper look into the way we walk. To do this, we downloaded the Accelerometer app to our phones. We put our phones at our center of gravity: the lower stomach. Prior to this, we took note of our height, our leg length, the amount of steps we would take, and the amount of time we would walk for. After walking for 8 steps and 6 seconds, we stopped the Accelerometer, and we had a set of data to work with. I then made a graph using the data, which had an x, y, and z axis.
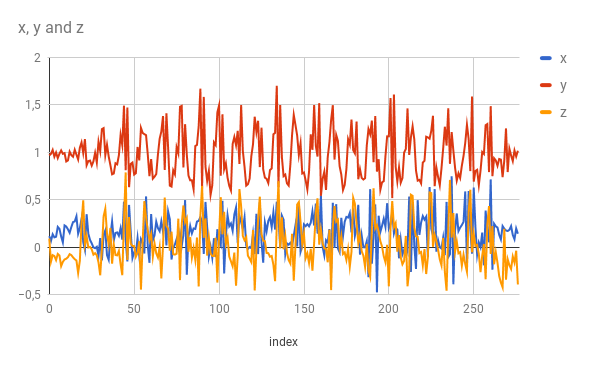
Katie's Data
Katie's Data
Emily's Height: 5'9 Katie's Height: 5'5
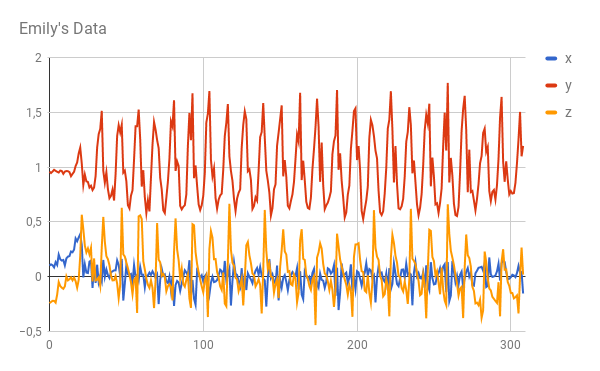
When I compared Emily's data to my own data, I noticed a few differences. My x axis had more movement than Emily's, which means I walked with more side- to- side motion. Emily's y axis had more movement than mine, which means that she walked with more up and own motion. We both had similar z axis, which means we walked at about the same pace.
This activity was useful, as it was a good introduction to Gait Analysis. I feel that everyone I worked with contributed an appropriate amount to finding out how Gait Analysis works. I struggled with transferring my data to the class spread sheet, but another classmate shared their computer knowledge with me and I eventually figured it out. I was also unsure of how to make a model displaying the trends, but then I realized I was overthinking it, and simply made two graphs comparing my steps to a classmate's. I feel that I gained a deeper understanding of motion and how things move, and would like to continue to learn more about the specifics of this.
